
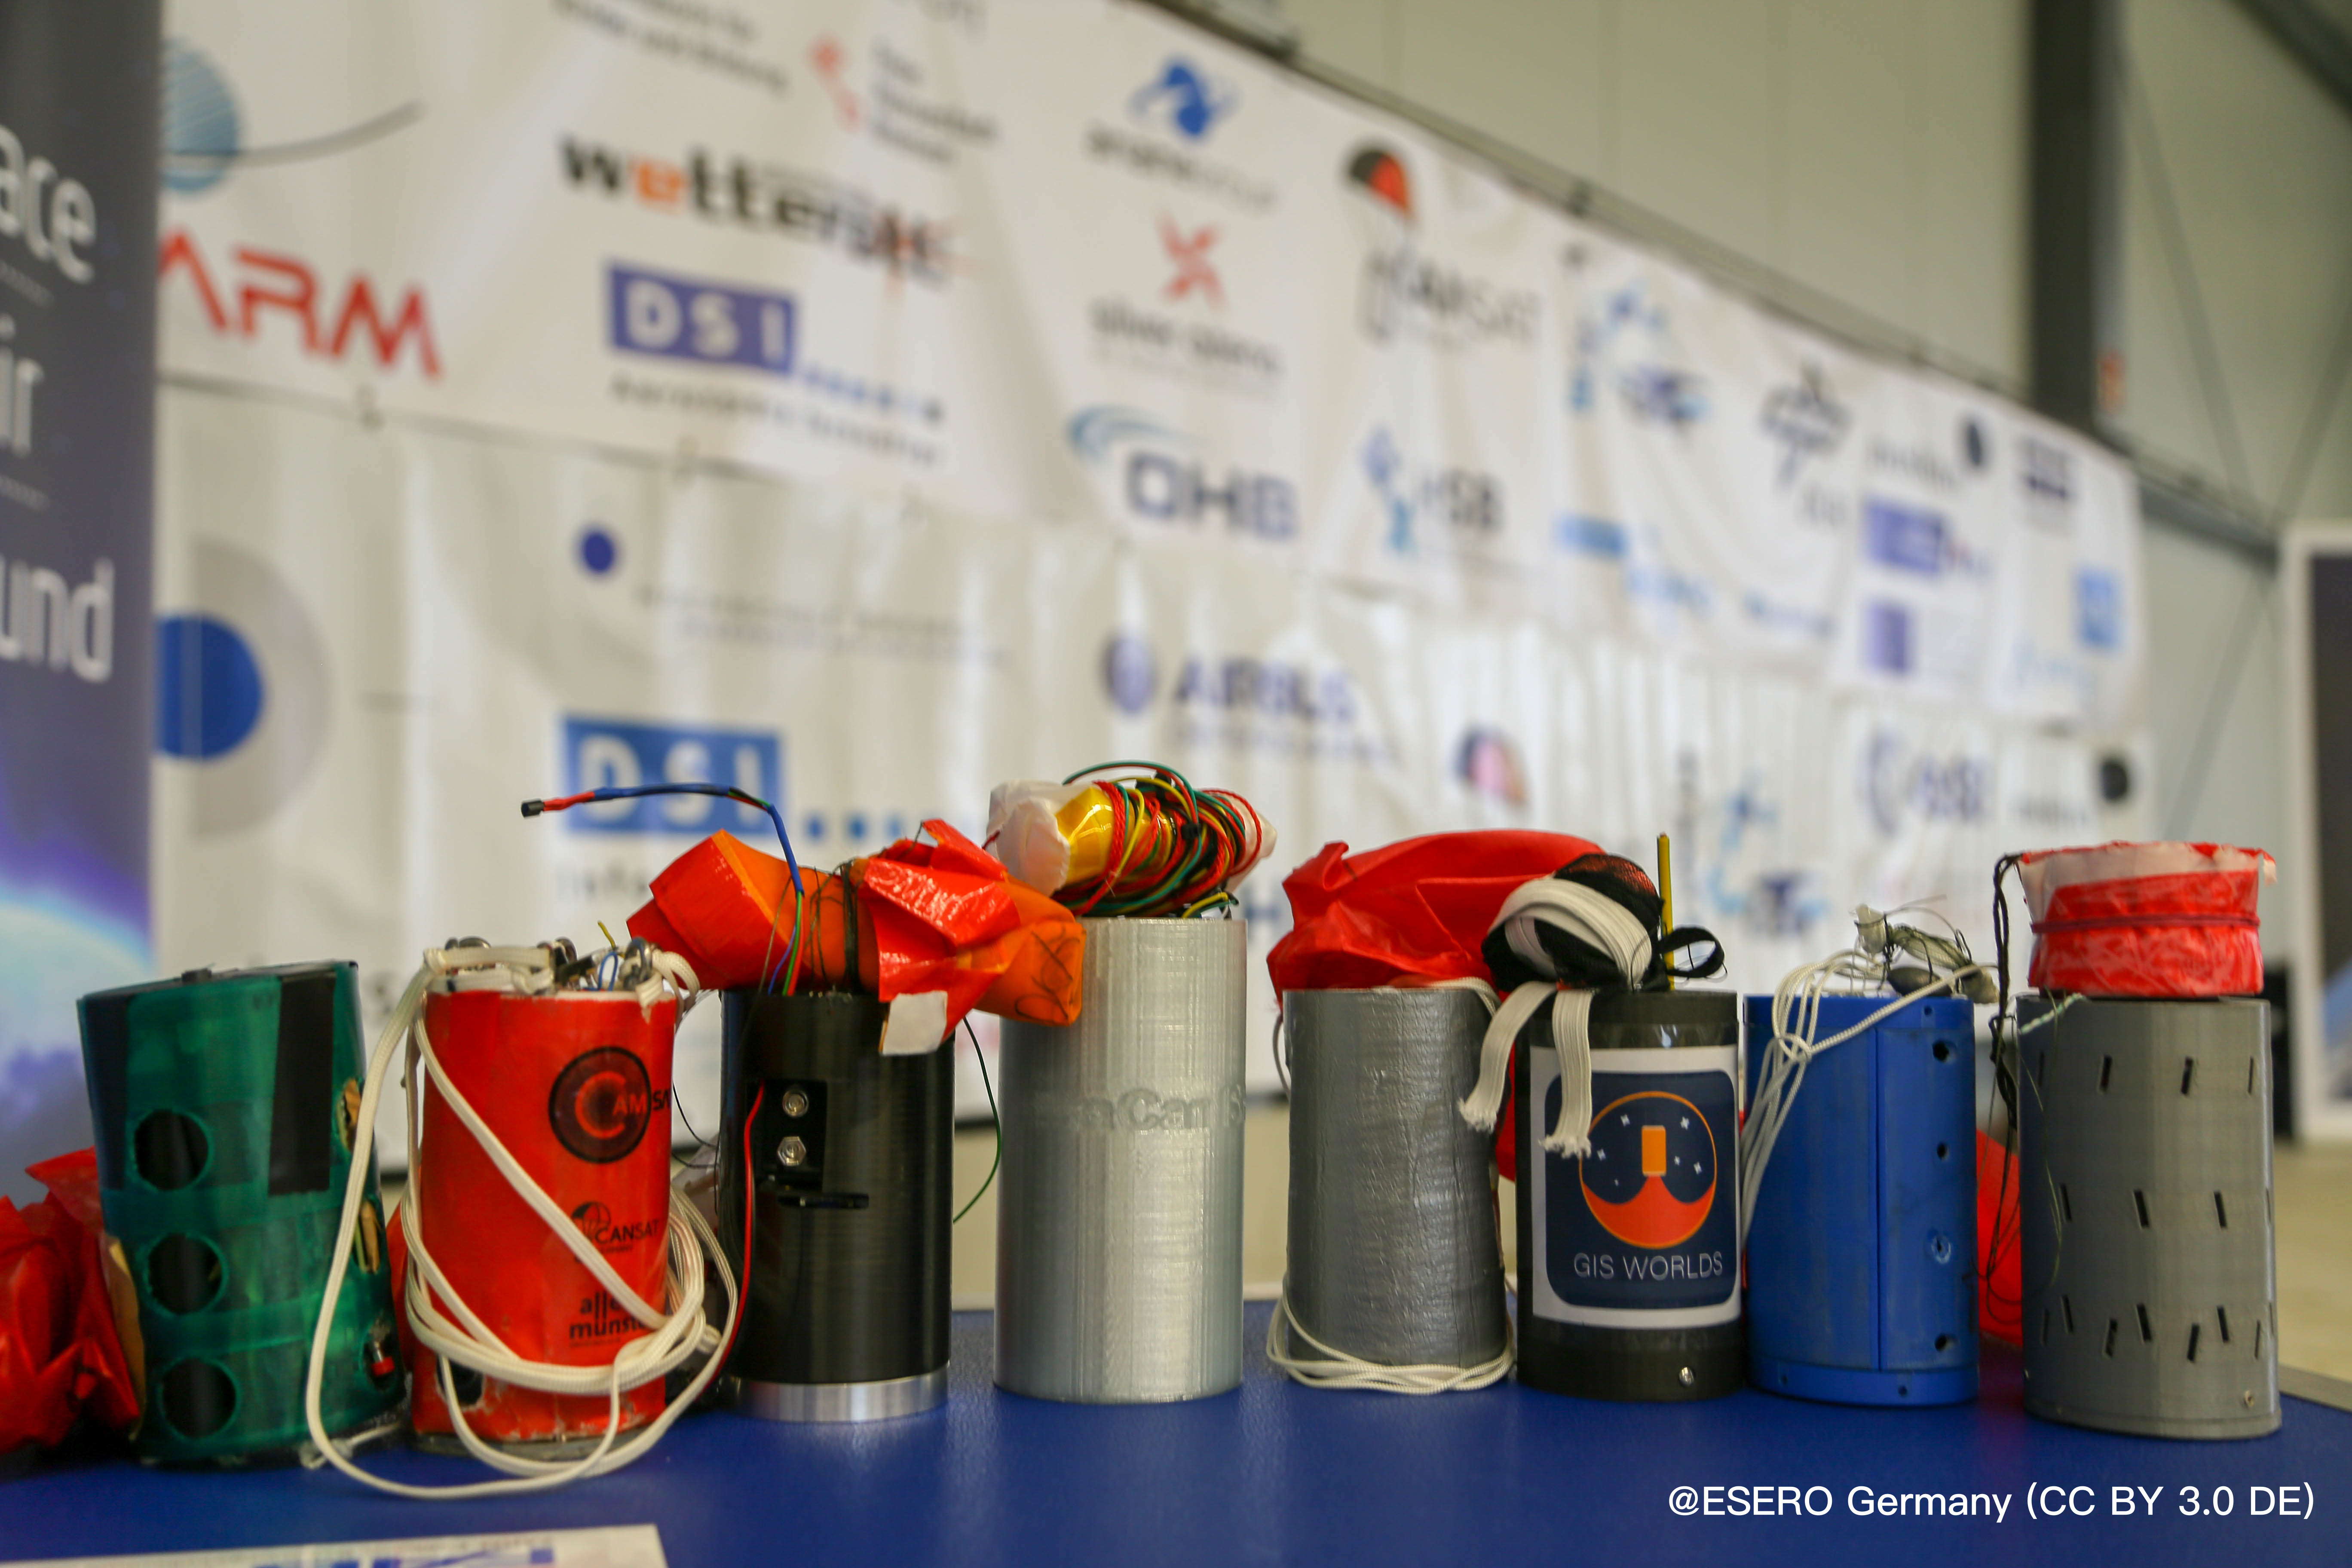
Minisatellites of the German CanSat Competition
In the German CanSat competition, schoolchildren from all over Germany build their own mini-satellites and experience all the phases of a space mission. (Christina Nadolsky, @ESERO Germany (CC BY 3.0 DE))
Minisatellites of the German CanSat Competition
In the German CanSat competition, schoolchildren from all over Germany build their own mini-satellites and experience all the phases of a space mission. (Christina Nadolsky, @ESERO Germany (CC BY 3.0 DE))
Minisatellites of the German CanSat Competition.
In the German CanSat competition, schoolchildren from all over Germany build their own mini-satellites and experience all the phases of a space mission. (Christina Nadolsky, @ESERO Germany (CC BY 3.0 DE))
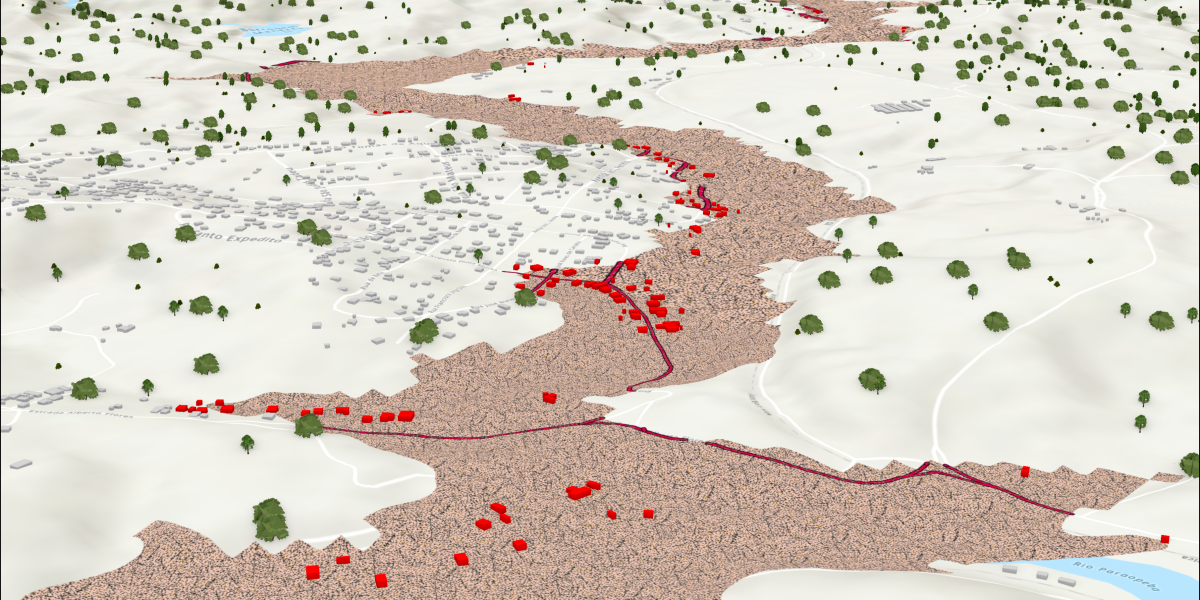
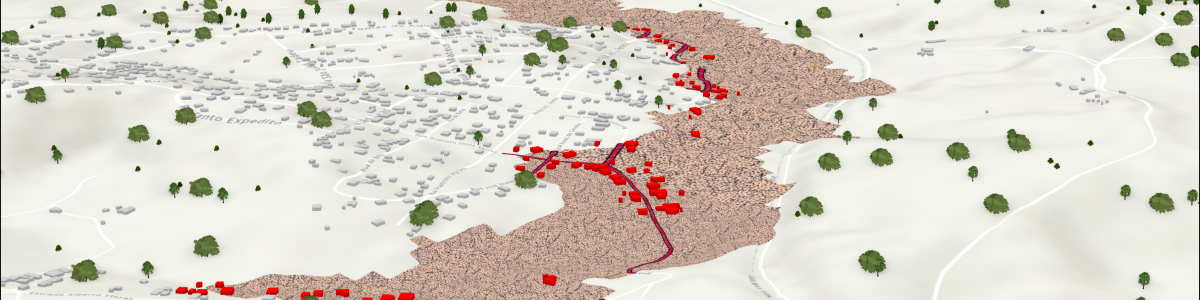
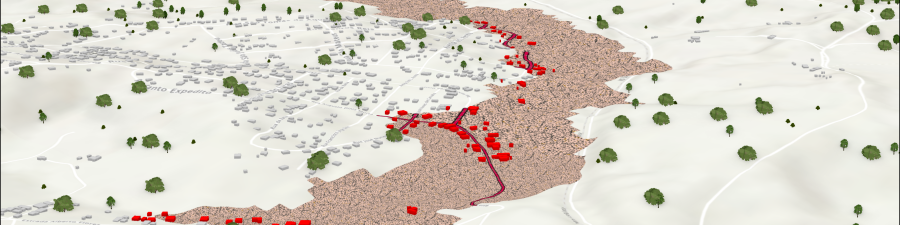
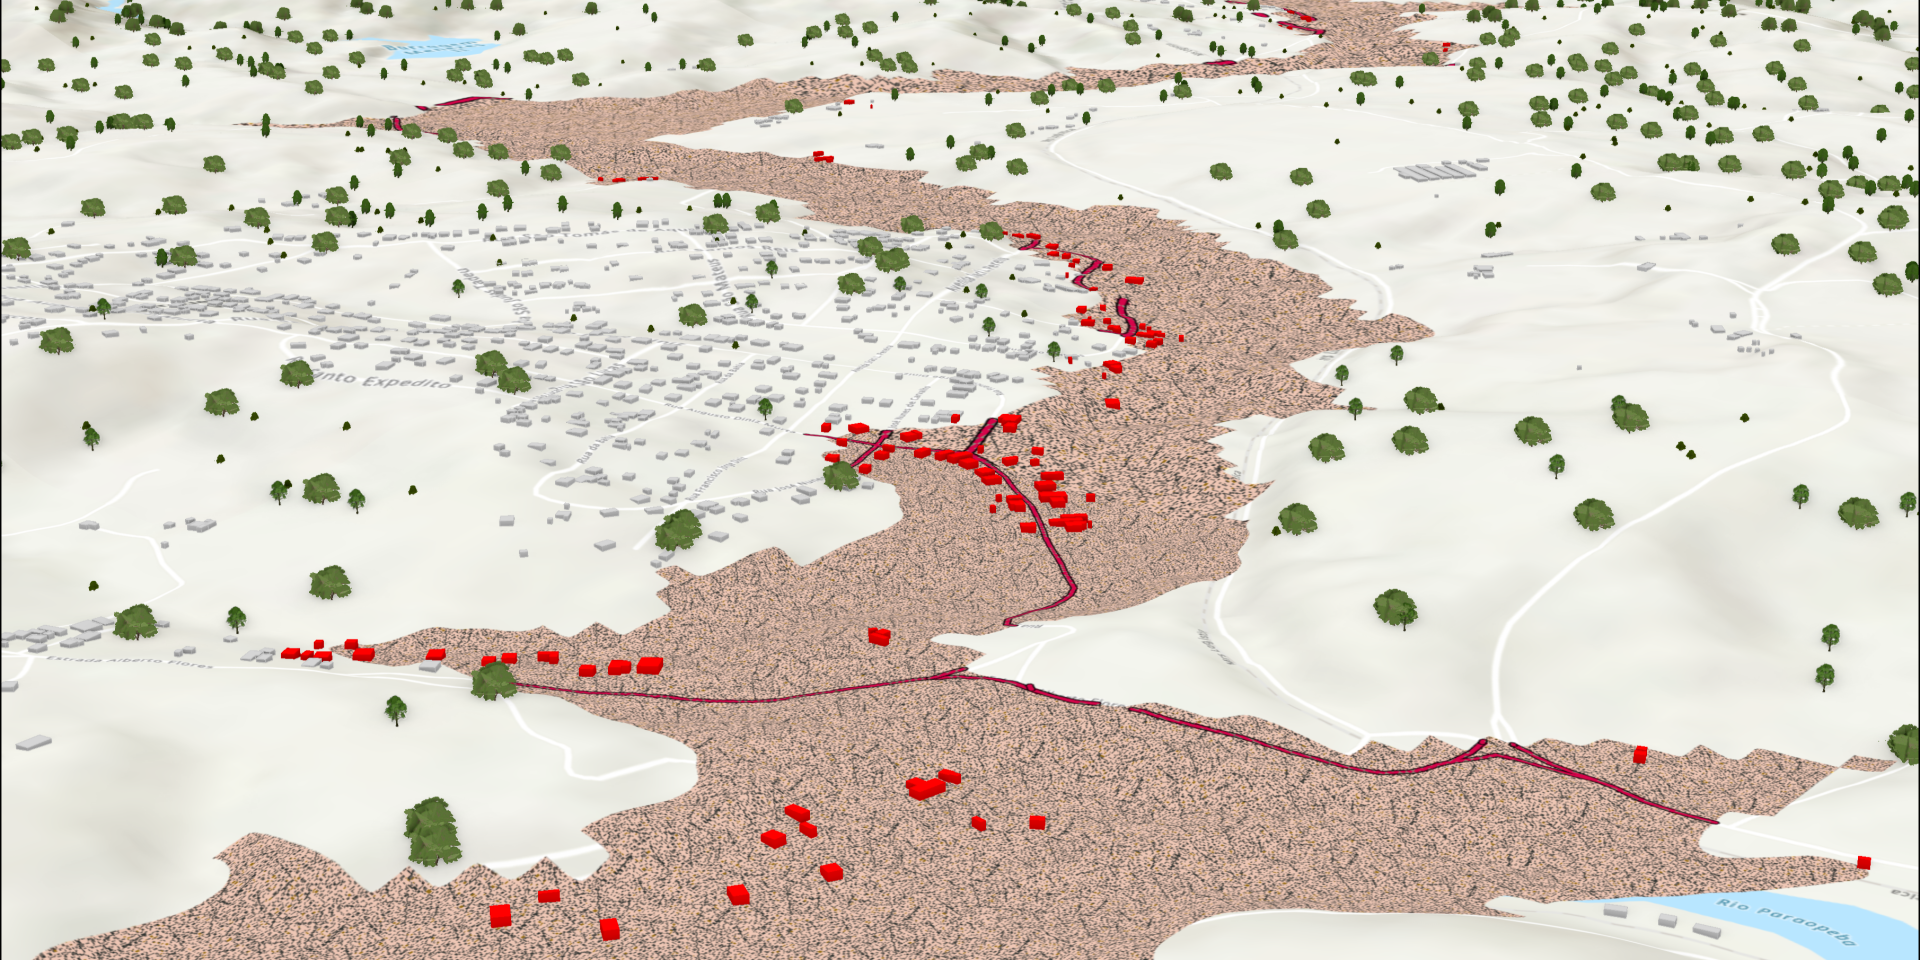
Tailings Dam Break Brumadinho
Simulation result of a GIS-based model for the calculation of spatially affected areas of the tailings storage facility dam failure in Brumadinho. (Torben Dedring, Sources: Esri, Airbus DS, USGS, NGAm NASA, CGIAR, N Robinson, NCEAS, NLS, OS, NMA, Geodatastyrelsen, Rijkswaterstaat, GSA, Geoland, FEMA, Intermap and the GIS user community, Esri Community Maps Contributors, HERE, Garmin, METI/NASA)
Tailings Dam Break Brumadinho.
Simulation result of a GIS-based model for the calculation of spatially affected areas of the tailings storage facility dam failure in Brumadinho. (Torben Dedring, Sources: Esri, Airbus DS, USGS, NGAm NASA, CGIAR, N Robinson, NCEAS, NLS, OS, NMA, Geodatastyrelsen, Rijkswaterstaat, GSA, Geoland, FEMA, Intermap and the GIS user community, Esri Community Maps Contributors, HERE, Garmin, METI/NASA)

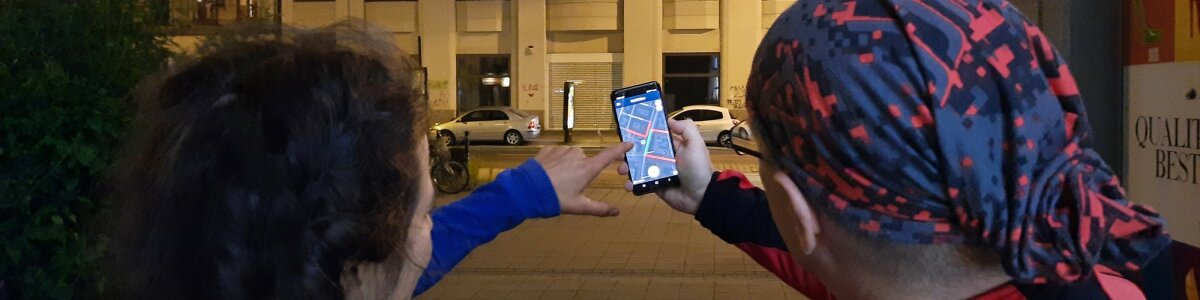
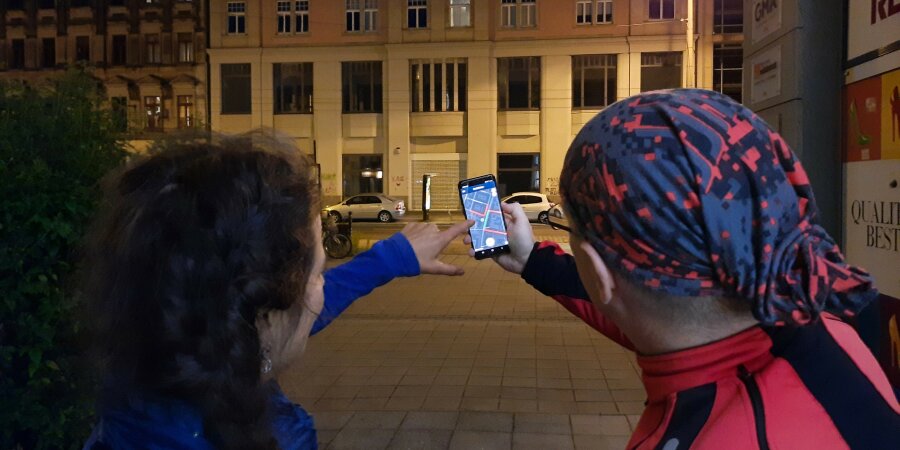
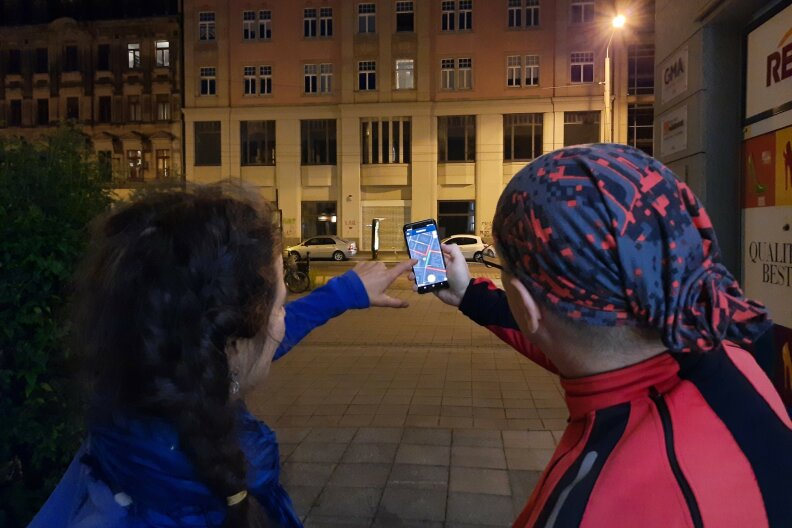
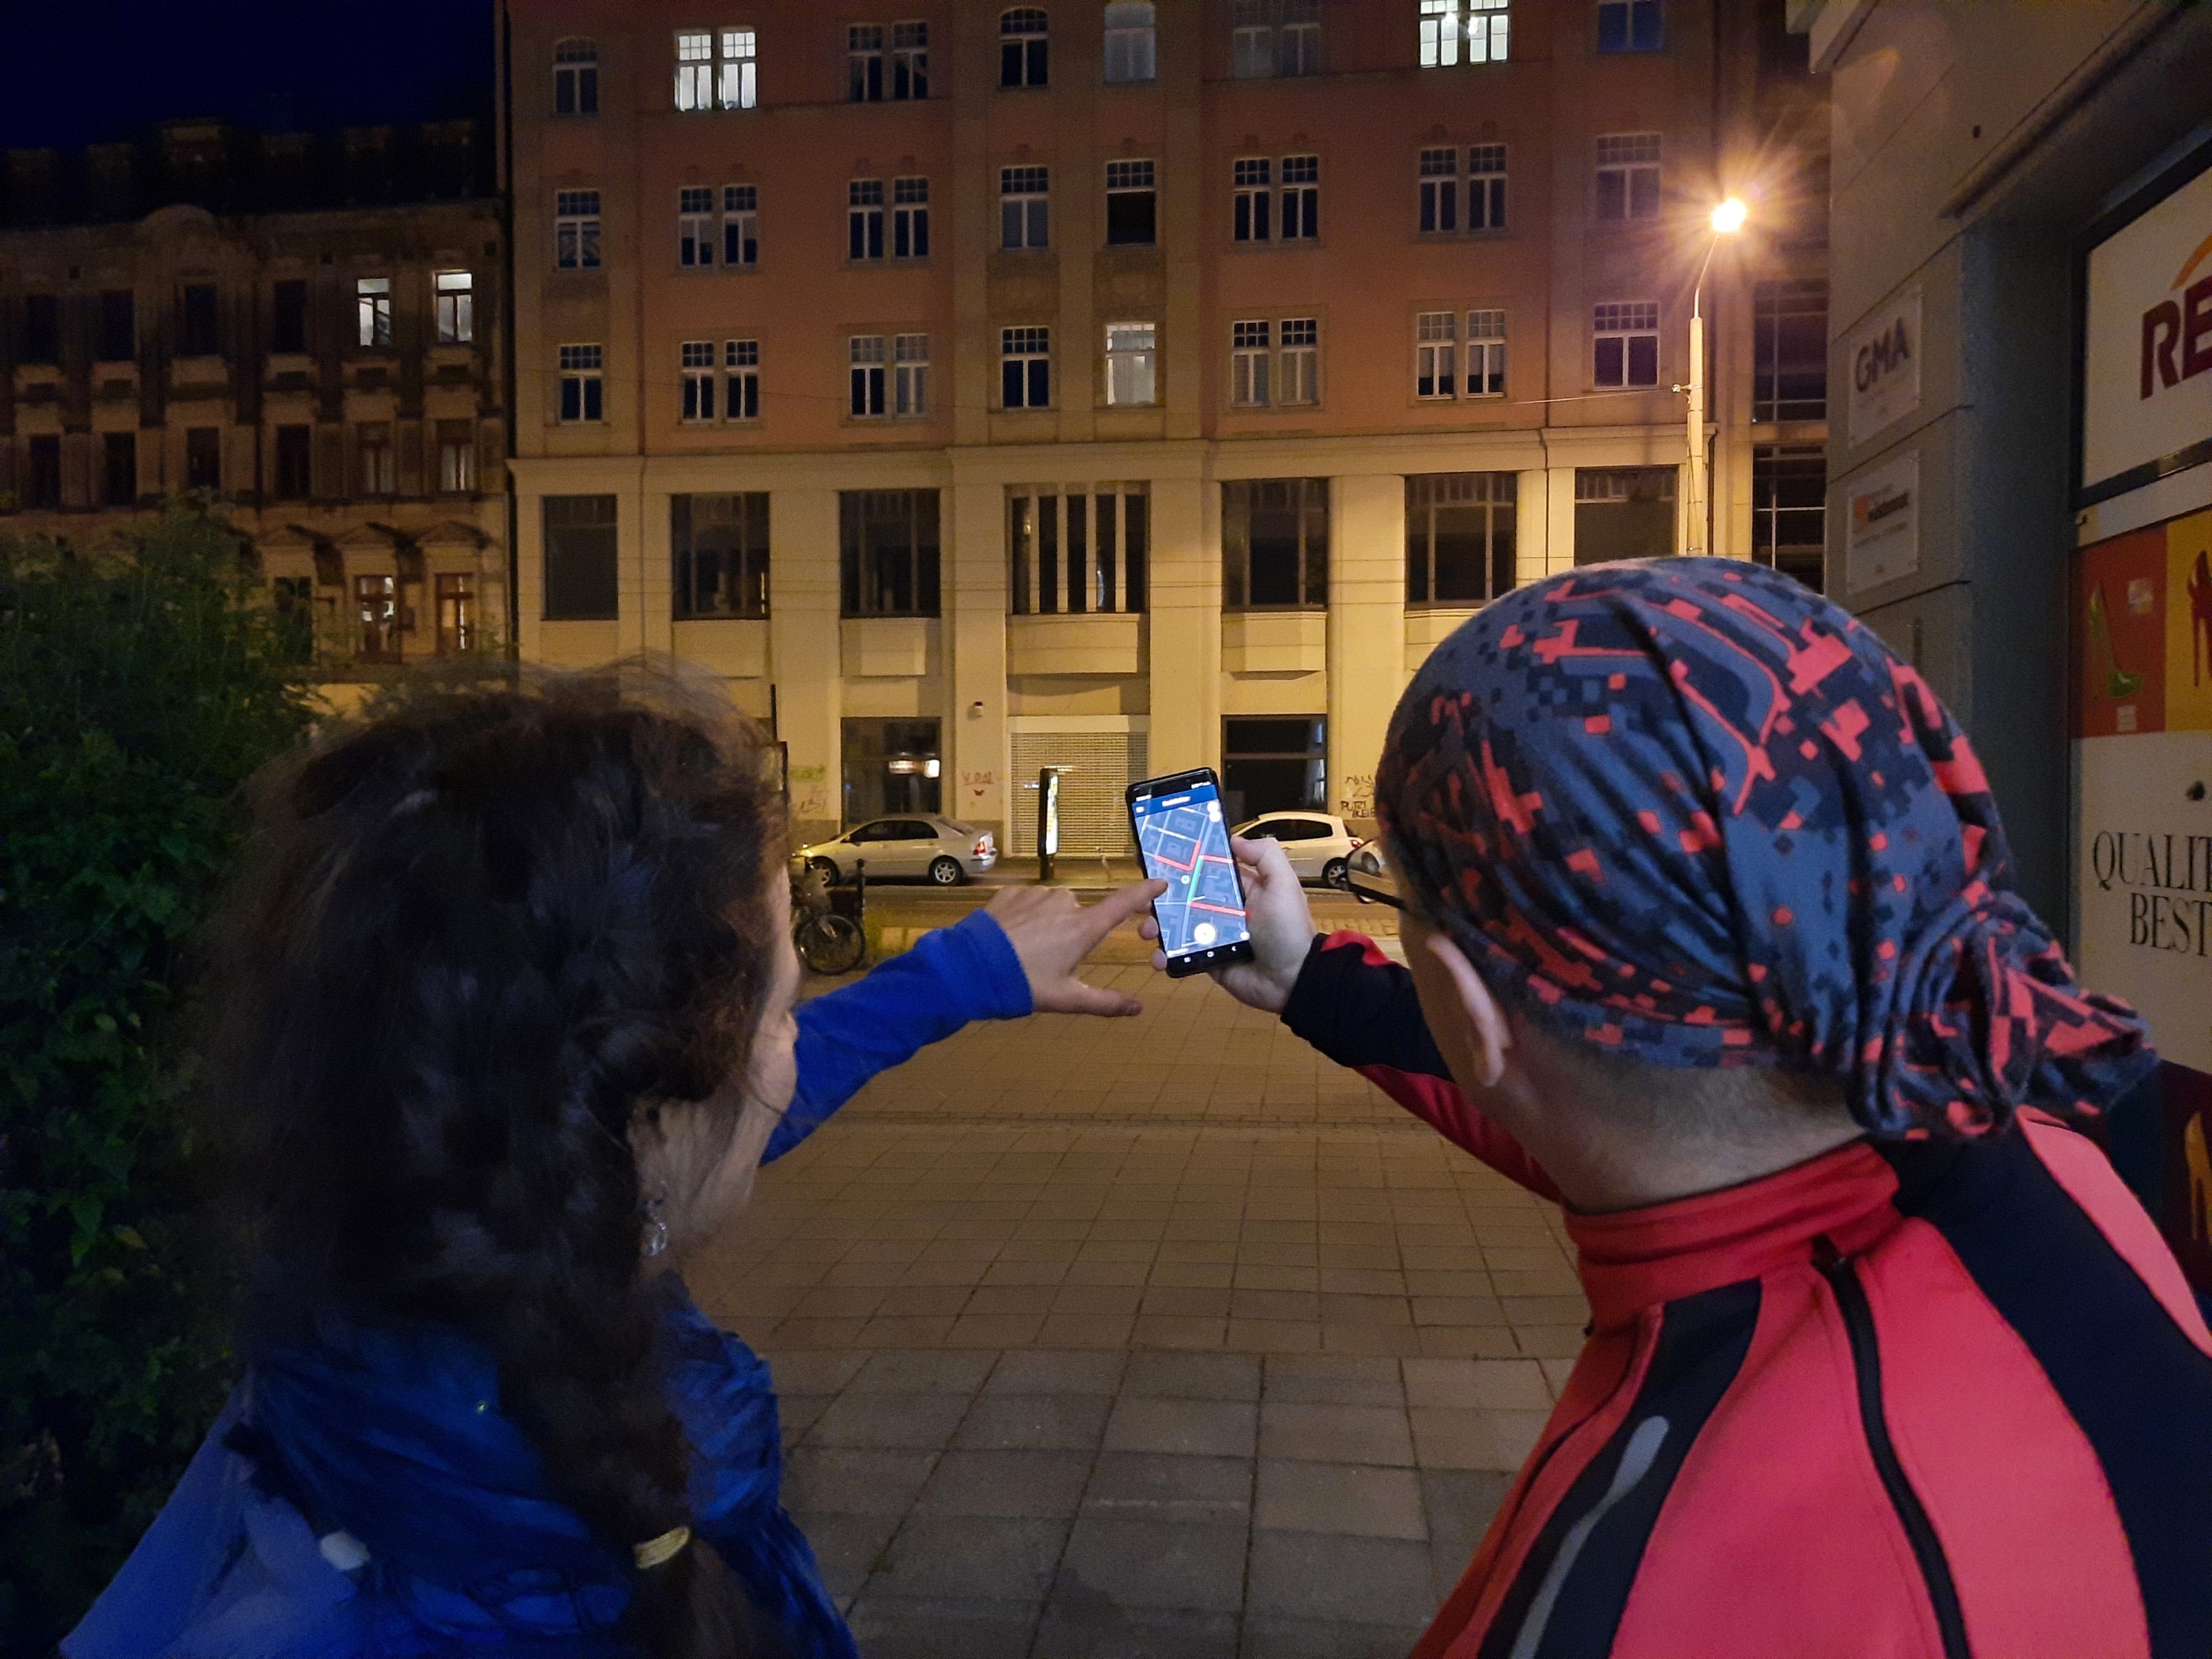
Nachtlichter app observation
The image shows two people using the Nachtlichter app to categorize an ourdoor light source. (Stefanie Partsch (2021))
Nachtlichter app observation
The image shows two people using the Nachtlichter app to categorize an ourdoor light source. (Stefanie Partsch (2021))
Nachtlichter app observation.
The image shows two people using the Nachtlichter app to categorize an ourdoor light source. (Stefanie Partsch (2021))

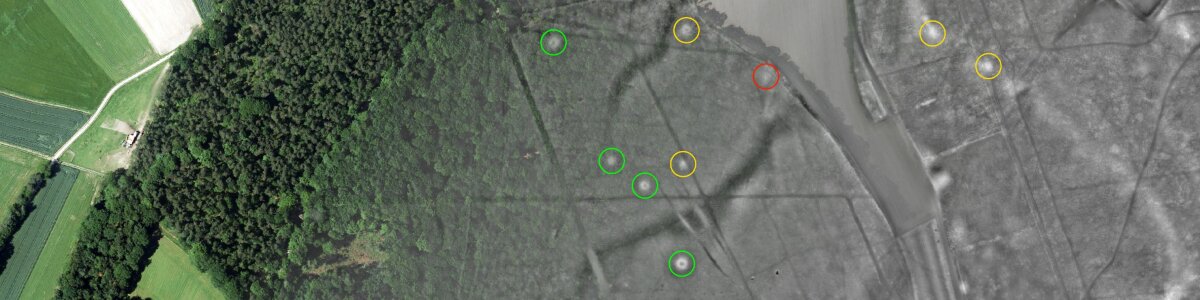
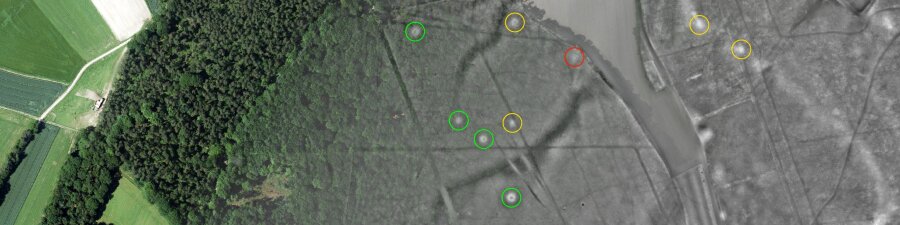
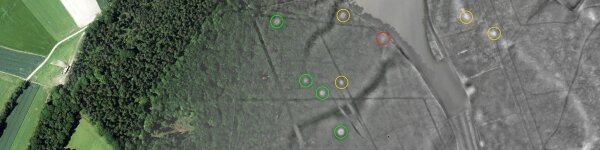
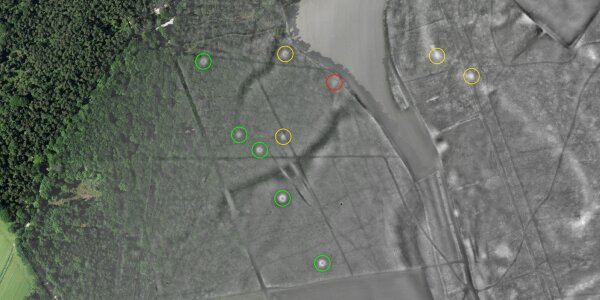
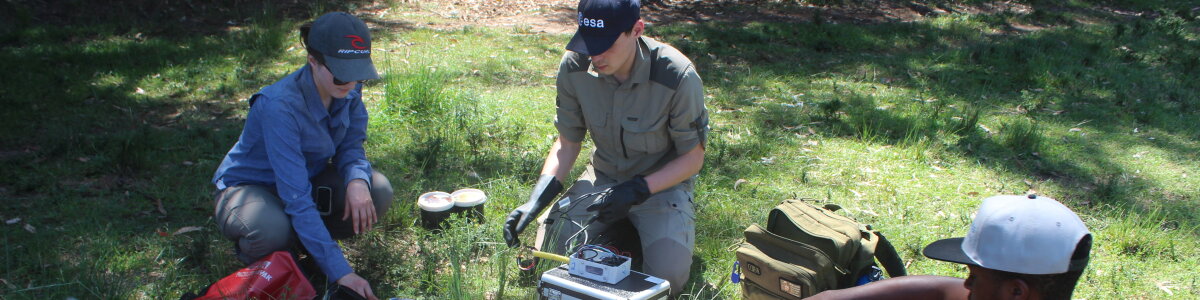
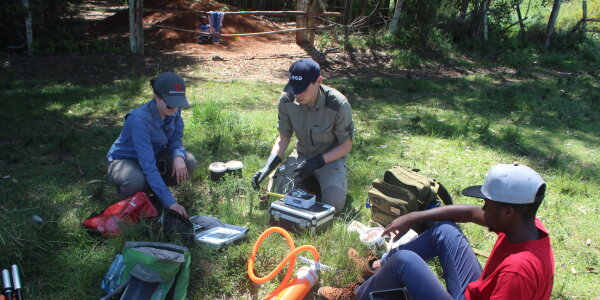
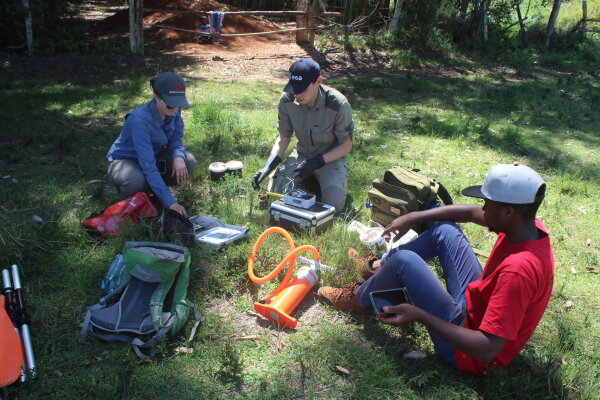
Field work.
(Steinbach, Goebel, Dedring, Bartels, Rienow)
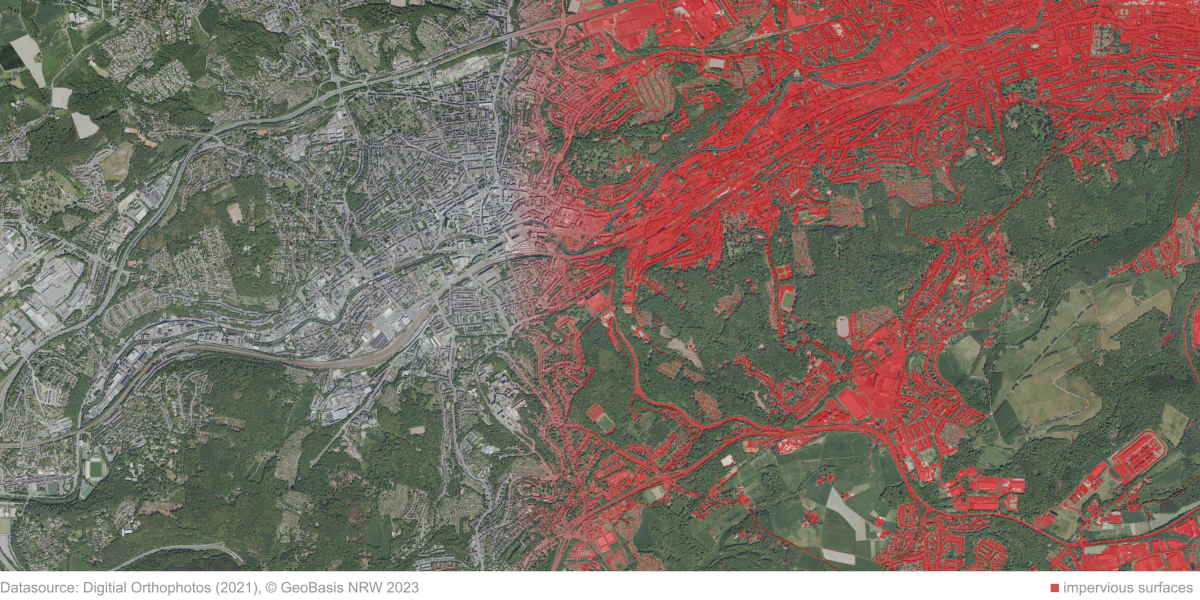
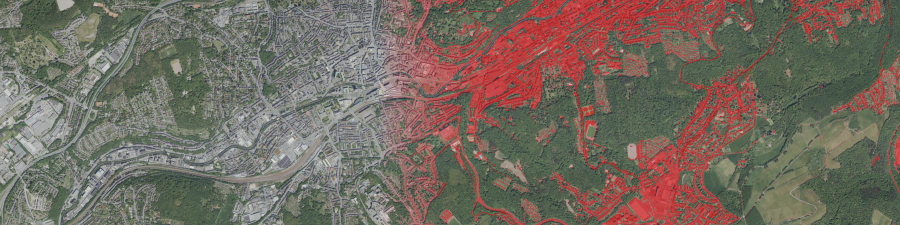
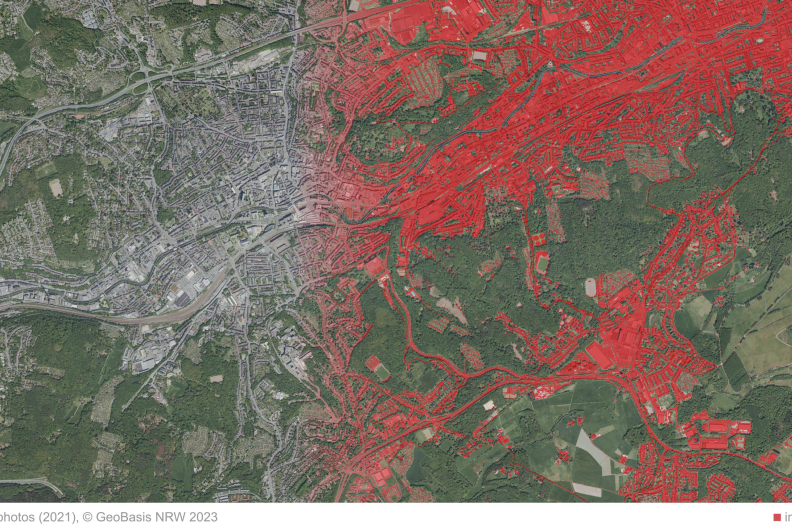
Sealed surfaces in the urban area of Wuppertal
Left: Digital orthophoto (2021), Right: Overlay with created sealing layer. (Jan-Philipp Langenkamp, Quelle: Digitale Orthophotos (2021), © GeoBasis NRW 2023)
Sealed surfaces in the urban area of Wuppertal
Left: Digital orthophoto (2021), Right: Overlay with created sealing layer. (Jan-Philipp Langenkamp, Quelle: Digitale Orthophotos (2021), © GeoBasis NRW 2023)
Sealed surfaces in the urban area of Wuppertal.
Left: Digital orthophoto (2021), Right: Overlay with created sealing layer. (Jan-Philipp Langenkamp, Quelle: Digitale Orthophotos (2021), © GeoBasis NRW 2023)
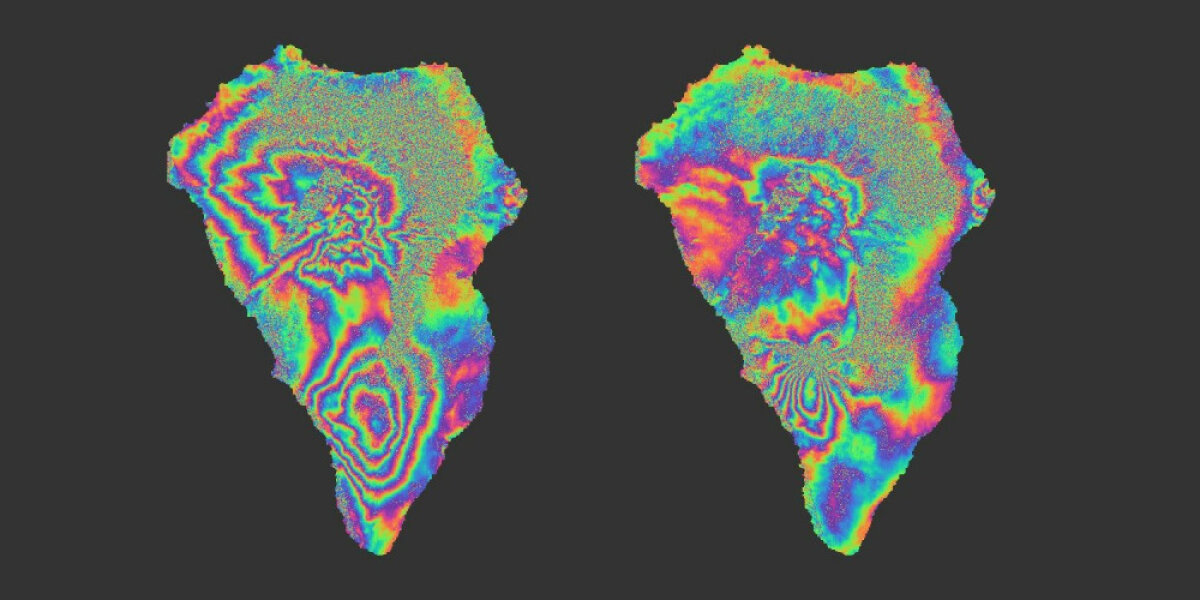
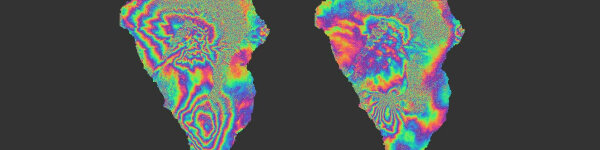
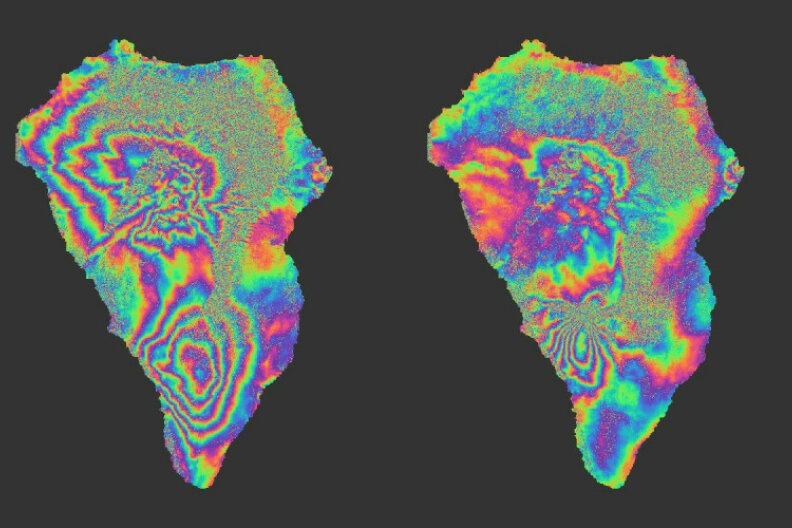
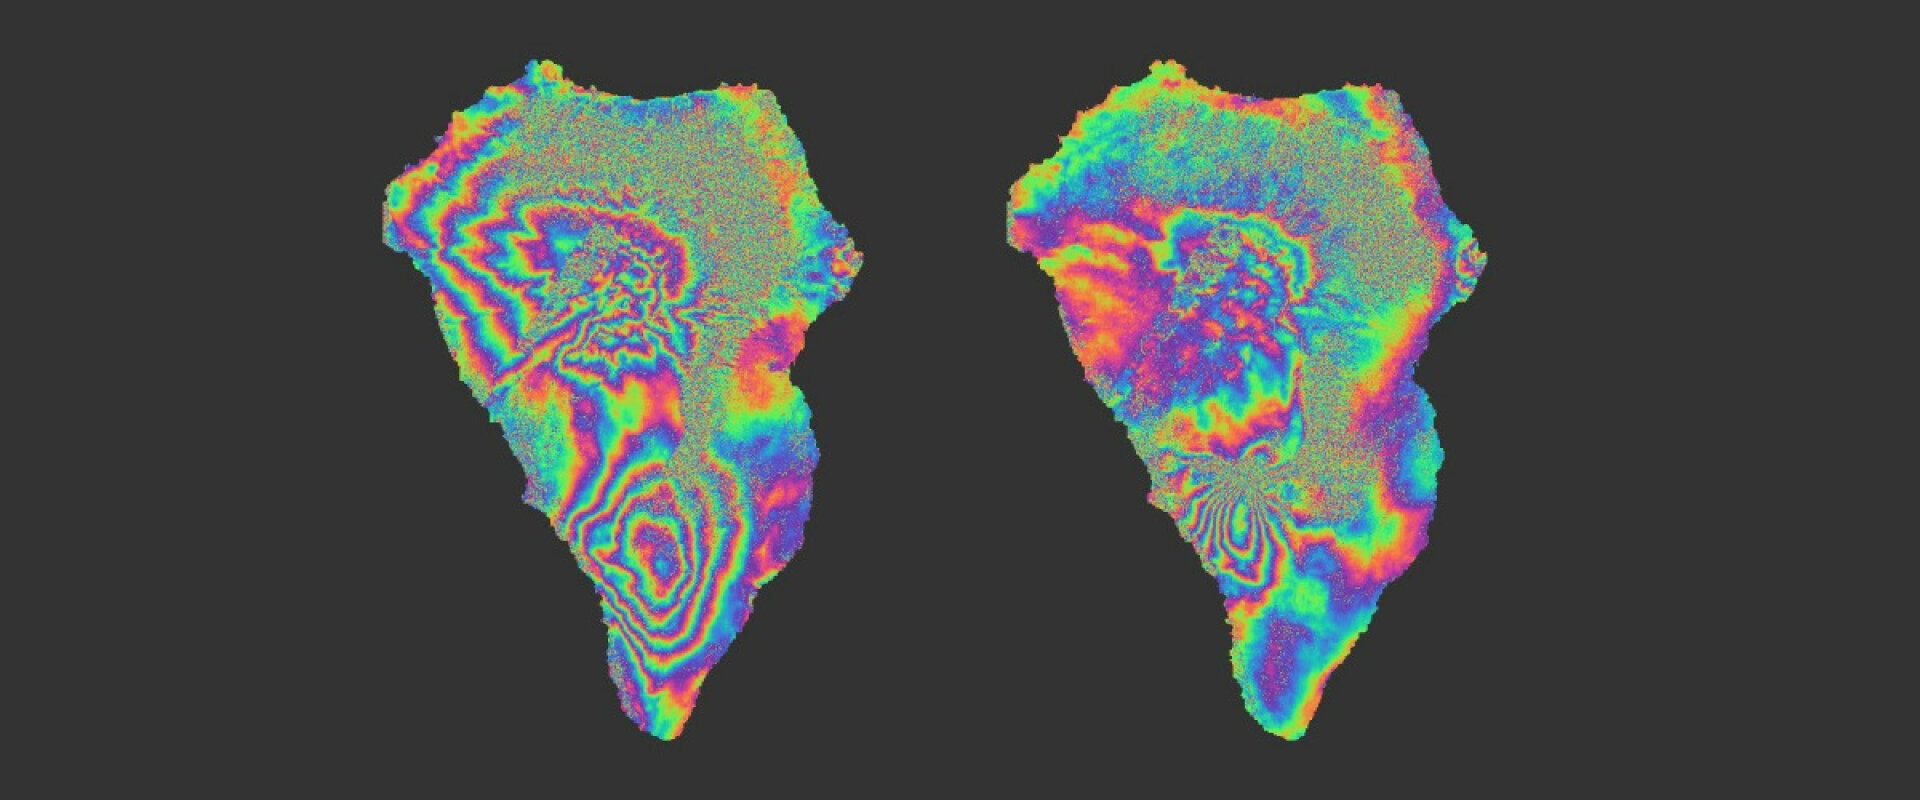
SAR-Interferometry for volcanic eruptions
This image shows the usage of SAR-Interferometry measuring seismic activity at the Cumbre Vieja volcano on the island of La Palma shortly before (l.) and after (r.) the first eruption in September 2021. (Roman Hiby 2022)
SAR-Interferometry for volcanic eruptions
This image shows the usage of SAR-Interferometry measuring seismic activity at the Cumbre Vieja volcano on the island of La Palma shortly before (l.) and after (r.) the first eruption in September 2021. (Roman Hiby 2022)
SAR-Interferometry for volcanic eruptions.
This image shows the usage of SAR-Interferometry measuring seismic activity at the Cumbre Vieja volcano on the island of La Palma shortly before (l.) and after (r.) the first eruption in September 2021. (Roman Hiby 2022)
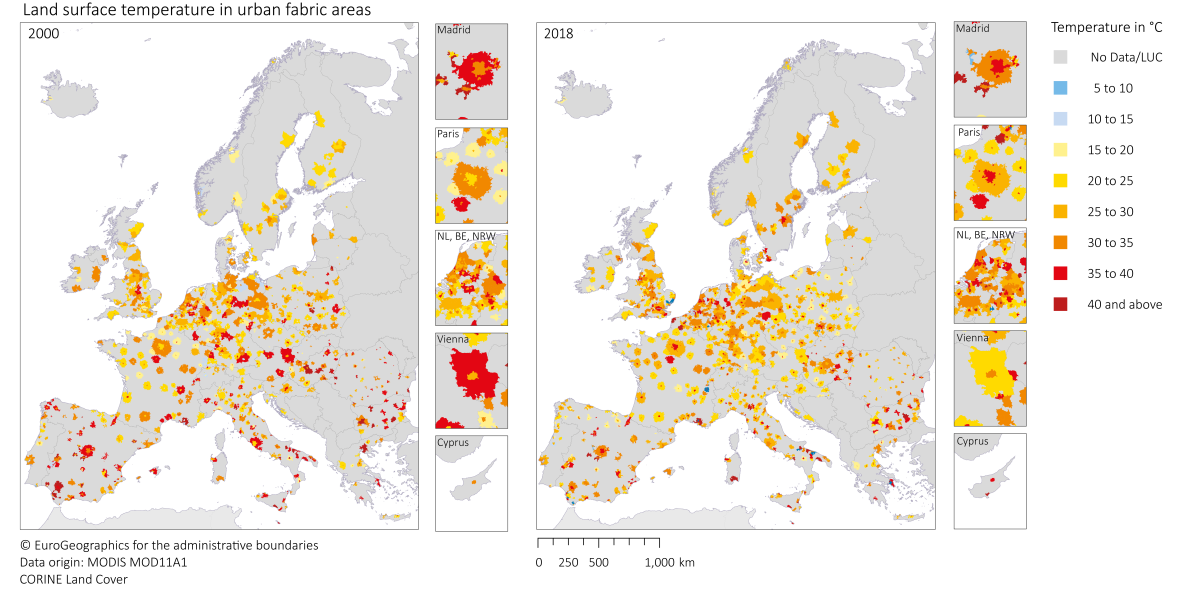
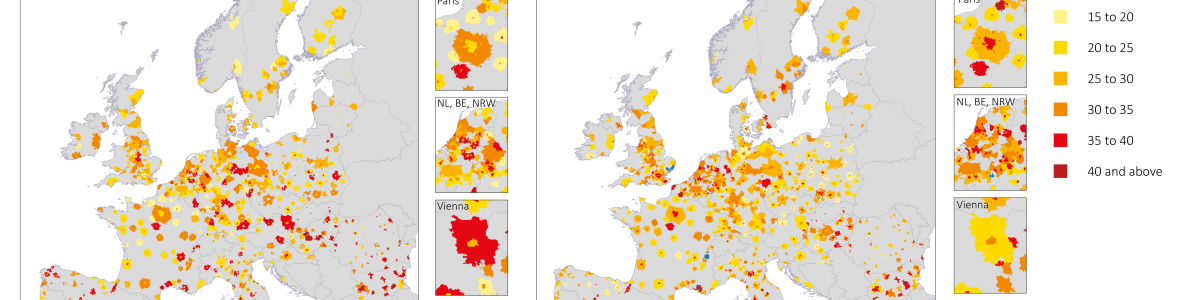
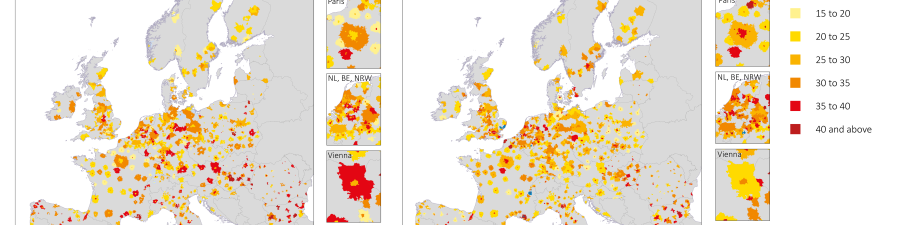
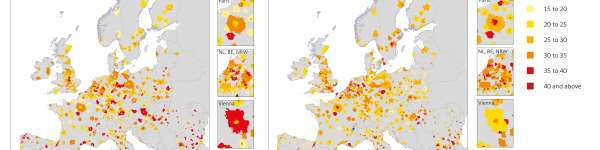
Land surface temperature in urban fabric areas 2000 (l.) and 2018 (r.)
(Anna Hellings, © EuroGeographics for the administrative boundaries. Data Origin: MODIS MOD11A1, CORINE Land Cover)
Land surface temperature in urban fabric areas 2000 (l.) and 2018 (r.)
(Anna Hellings, © EuroGeographics for the administrative boundaries. Data Origin: MODIS MOD11A1, CORINE Land Cover)
Land surface temperature in urban fabric areas 2000 (l.) and 2018 (r.).
(Anna Hellings, © EuroGeographics for the administrative boundaries. Data Origin: MODIS MOD11A1, CORINE Land Cover)

